Portfolio Optimization features
Take advantage of the fastest and more robust portfolio optimization engine available
OptiFolio employs a global non-linear constrained stochastic genetic optimization engine to find the best investment strategies. In simple terms: robust results in record time.
The Risk / Return plane
The Nobel-winning Modern Portfolio Theory (MPT) analyzes and compares possible investment strategies as points on a plane. The vertical axis shows the expected return of the investment, while the horizontal axis represents the expected risk of the investment.
Consider, for example, the following chart depicting three stocks labelled 1, 2 and 3. Each stock is located in a point whose coordinates represent the asset's expected risk and return.
The lines connecting each pair of points represent all the portfolios that would result by combining a certain proportion of each of the two assets.

Risk diversification
From examining the previous chart, it would appear that the minimum level of risk an investor could get is the risk of asset labelled 1. However, this is only true because this chart has one key assumption behind it: the return correlations between each pair of assets is exactly 1.
A correlation measures the level of association or synchronization between the returns of two assets and can be any number from -1 to +1. A correlation of +1 means that both assets are in perfect sync (i.e. when one has positive returns, the other is also having positive returns and vice-versa). A correlation of zero means that both assets are not synchronized at all. The following picture summarizes these ideas.

Now let's see what would happen with the initial three-assets chart if we reduce the assumed correlations for each pair of assets and change the pure asset's positions slightly with the help of OptiFolio. Notice how the combined portfolios now form curves. The key aspect of these curves is that in some points (i.e. portfolios) the investor may effectively achieve lower levels of risk than the most secure asset of the corresponding pair. This curving effect is called "diversification".

The model with many assets simultaneously
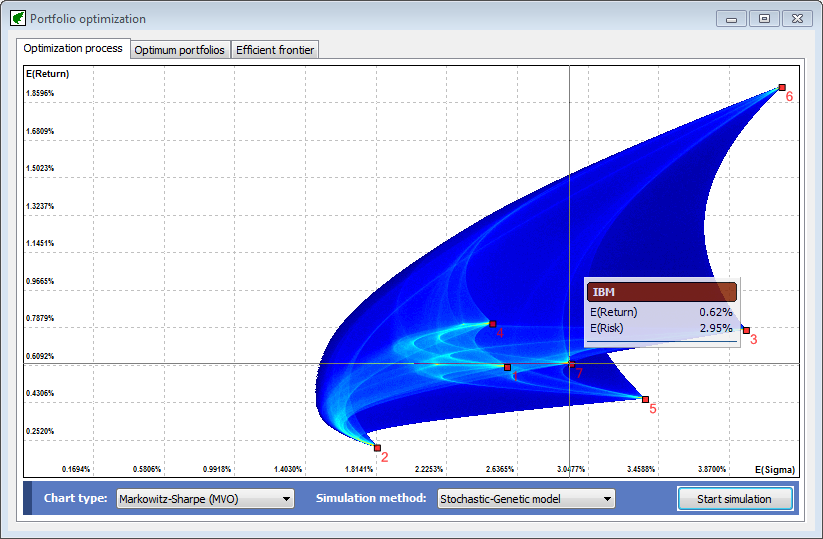
When many assets are considered simultaneously as investment candidates, the potential portfolios that may be constructed form a small surface called the "feasible investment area". Let's take a look at an example of this area using OptiFolio.
As you can see, an umbrella-shaped surface emerges. Now each blue or cyan point represents a particular combination of risk and return that may be obtained by combining the seven assets under analysis. The red maks (as shown with the crosshair) represent pure assets. The cyan color gives us an idea of the internal structure of the feasible area. Lighter colors are associated with points more densely populated by portfolios.
The model when investment constraints are added
When investment constraints are added, the size of the feasible area is reduced. This happens because some portfolios are now unreachable because they would violate some constraint. Look at the following example build using OptiFolio.

The security selection process
Security selection refers to the selection of one special portfolio that we consider as "the best". This portfolio will have a particular combination of assets, the best position for the investor. Using OptiFolio it is easy to identify the optimum portfolios and their compositions. Look at the following example.
Here we see a constrained feasible area. The best portfolios will be those with higher expected returns (to the North) and lower expected risk levels (to the West). By moving the mouse over this "frontier", the software automatically shows us the main features of the selected portfolio.

Moreover, we can ask the software to locate the best portfolios in terms of Risk and Risk-Adjusted-Return, as you can see here.
